.png?width=3334&height=468&name=Shipfusion_Logo%20Color%20Light%20(1).png "Shipfusion_Logo Color Light (1)")
.png?width=2850&height=400&name=Shipfusion_Logo%20Color%20Light%20(1).png "Shipfusion_Logo Color Light (1)")
Share this
by Kyla Friel on Oct. 13, 2023

Understanding and optimizing inventory is crucial for the continued growth of an ecommerce business. A physical storefront wouldn’t pile up unsold items forever or leave parts of the store bare. Your ecommerce store should also avoid the pitfalls of overstocking or understocking. But how can you ensure you’re managing your inventory correctly? One way is to measure the inventory turnover ratio for your business.
The inventory turnover ratio (ITR) is an important metric that helps in the assessment of inventory management. This article will explore what the inventory turnover ratio is, how to calculate it, and its importance for ecommerce businesses. We’ve also included a free downloadable template that automatically calculates your company’s inventory turnover ratio, so your business can have instant access to these insights.
What is the inventory turnover ratio?
The inventory turnover ratio is a financial metric. It measures the number of times a company’s inventory is sold and replaced over a defined period of time. Most ecommerce companies will look at it on a yearly basis. The inventory turnover ratio gives an insight into a company’s efficiency in managing and selling its inventory.
A high ratio shows that inventory sells quickly. A lower ratio can indicate that inventory is moving slowly.
The inventory turnover ratio can determine if a business consistently has more inventory than it needs. It can also help measure whether the business is managing their inventory correctly or not, whether enough product is being moved, and if they are improving inventory turnover year over year.
The Inventory Turnover Ratio Formula
To calculate the inventory turnover ratio, use the following formula:
Cost of Goods Sold ÷ Average Inventory = Inventory Turnover Ratio
Where:
- COGS is the total cost of goods sold during a particular period.
- Average Inventory is the average amount of inventory held by the business during the same period.
Finding the Figures for Your Inventory Turnover Ratio Formula
Cost of Goods Sold (COGS)
Cost of Goods Sold represents the total cost of producing the goods that have been sold by a business. It includes direct costs like raw materials, labor involved in manufacturing the product, and other direct production costs. COGS does not include indirect costs, such as distribution or sales force costs.
To determine your company’s COGS, you’d typically turn to your financial statements. The income statement will have a detailed breakdown of costs. This should let you see the amount you’ve spent on creating and preparing your products for sale during a particular period.
Average Inventory
Average Inventory provides a snapshot of the typical amount of stock a business has on hand over a specific period. This metric balances the starting and ending inventory levels. It provides a fairer view since inventory levels can change during a period, depending on different factors.
Calculating your average inventory number is simple. Take the inventory level at the start of the period (beginning inventory) and the inventory level at the end (ending inventory). Add them together, and then divide by two.
To get these inventory numbers, you’d look at your balance sheet. It should list both the opening and closing inventory values for the time frame you’re analyzing.
How to Calculate the Inventory Turnover Ratio of Your Ecommerce Business
Imagine you operate an online store named “EcomGadgets” that sells tech gadgets.
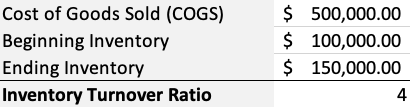
1. Cost of Goods Sold (COGS): From your financial statements, you determine your COGS for the year is $500,000. This represents the direct costs of producing the gadgets you’ve sold during that year.
2. Average Inventory Calculation:
- At the start of the year (Beginning Inventory), you had inventory valued at $100,000.
- By the year’s end (Ending Inventory), after various sales cycles and inventory replenishments, your remaining inventory is valued at $150,000.
To find the Average Inventory: Add the Beginning Inventory ($100,000) to the Ending Inventory ($150,000), which totals $250,000. Then, divide this sum by 2 to get $125,000 as your Average Inventory for the year.
3. Inventory Turnover Ratio Calculation: To calculate the ITR, divide your COGS ($500,000) by the Average Inventory ($125,000). This gives you a ratio of 4.
This ratio means that EcomGadgets successfully sold and replenished its entire inventory four times throughout the year.
You can download our free inventory management calculator template that includes the formulas for both ending inventory and the inventory turnover ratio to gain instant insight into your company’s inventory.
What is a Good Inventory Turnover Ratio?
A “good” inventory turnover ratio can significantly vary across different industries, and there is no one-size-fits-all benchmark. Generally, a higher ITR suggests strong sales. The company is most likely effectively managing its inventory and selling its goods quickly. The company also may not spend as much on storage, insurance, and other holding costs.
On the other hand, a lower ITR may indicate poor sales and possibly excess inventory. This could lead to higher holding costs and lower liquidity.
Industry Specific Benchmarks
To understand what constitutes a good ITR, it’s essential to look at industry-specific benchmarks. A retailer with fast-moving consumer good fulfillment needs may have a high turnover ratio because of the type of products they sell. However, a car dealership would naturally have a lower turnover ratio given the higher value and less frequent purchases.
An inventory turnover ratio between 3 and 6 is considered reasonable for most ecommerce businesses.
Balancing the Ratio
Avoiding Overstocking: A high inventory turnover ratio is generally positive, but be wary of keeping it excessively high. It might indicate that you are understocking. This can lead to lost sales opportunities and unsatisfied customers because of the lack of products.
Avoiding Understocking: A low inventory turnover ratio is a sign that you might be overstocking. This could lead to increased holding costs and the risk of inventory obsolescence. Balancing your inventory levels to match your sales pattern is key to achieving an optimal inventory turnover ratio.
What Does the Inventory Turnover Ratio Tell You About Your Ecommerce Business?
The inventory turnover ratio is a powerful metric that reveals insights into your business operations, efficiency, and competitive positioning. Let’s look at what the ITR can specifically tell you about your ecommerce business.
Understanding Business Health
The inventory turnover ratio serves as a litmus test for your ecommerce business’s operational and financial health. An optimal ITR reflects a balance between your sales performance and inventory management. Achieving this balance can lead to reduced holding costs, minimized deadstock, and enhanced cash flow. All these factors are foundational for a sustainable ecommerce operation.
Identifying Challenges in Operations
A low ITR signals that your business might be holding more inventory than necessary, hinting at potential inefficiencies. Possible reasons for this could be low profits, incorrect pricing, ineffective advertising, or poor inventory management. On the flip side, a surprisingly high ITR might suggest frequent stockouts or understocking, which can affect customer satisfaction.
Benchmarking Against Competitors
ITR provides a yardstick to gauge your business performance relative to competitors. If your competitors are publicly traded, their financial statements can provide the data needed to calculate and compare ITRs. For privately-held competitors, industry averages, typically ranging between 4-6 for many ecommerce sectors, can offer a comparative benchmark.
How to Use the Inventory Turnover Ratio to Optimize Your Ecommerce Operations
Harnessing the insights derived from the ITR can be a game-changer for your ecommerce business. Here’s how you can actively use this metric to refine your operations and address potential pain points.
Using Historical Data to Predict Trends
The inventory turnover ratio is a useful metric to track when analyzing past performance to predict future sales trends. Tracking and comparing ITR year-over-year provides valuable insights. It’s not just about the absolute value of the metric, but the trend it showcases.
A rising ITR trend might be indicative of improved inventory management or increased sales, while a falling trend might point towards accumulating deadstock or reduced market demand. Understanding these trends helps businesses anticipate challenges and opportunities.
Addressing Inventory Problems
A consistently low ITR is a red flag. An issue underlying a low ITR might be challenges in accessing inventory when needed. This could be not having enough stock of popular items, or having too much stock of items that just don’t sell. It might be pointing to issues in your supply chain, procurement delays, or over-purchasing.
Investigating and then addressing the specific causes of a low ITR can prevent stockouts or overstock situations. Excess inventory can strain resources, from warehousing space to capital allocation. Using the inventory turnover ratio for more efficient ecommerce inventory management not only optimizes these resources but can also boost profits.
Aligning Product to Market
A mismatch between your product and its target market can dent sales and result in a low inventory turnover ratio. Whether it’s a design flaw or inadequate marketing efforts, bridging this gap is essential. Engage with your customer base to gain insights and help identify any problems with your offerings. Then refine your pricing strategies, production approach, or marketing accordingly.
Key Takeaways
The ITR is more than just a numerical metric. It helps provide a holistic view of your ecommerce operations, benchmarking internal processes and positioning against competitors. Its real power lies in its predictive nature, spotlighting pain points before they escalate.
An optimal inventory turnover ratio is essential for a successful ecommerce business. To get an accurate ITR, you need a clear understanding of your stock movements. But dealing with accurate inventory management while running an ecommerce business isn’t easy. That’s why partnering with a third-party logistics provider like Shipfusion can help your business grow.
With Shipfusion’s ecommerce inventory management software, you can easily synchronize inventory data across multiple channels in real time. This ensures you always know how quickly your stock is turning over. Our software is a key component of our ecommerce fulfillment services. It helps reduce stock holding times, improve cash flow, and increase customer satisfaction.
To learn how your business can optimize its inventory management and order fulfillment, contact our fulfillment experts today.
Share this

Using the Weighted Average Method for Inventory

Common Inventory Management Mistakes: Part Two
